

Home / Indicators / 1.2 InRegi XABCD
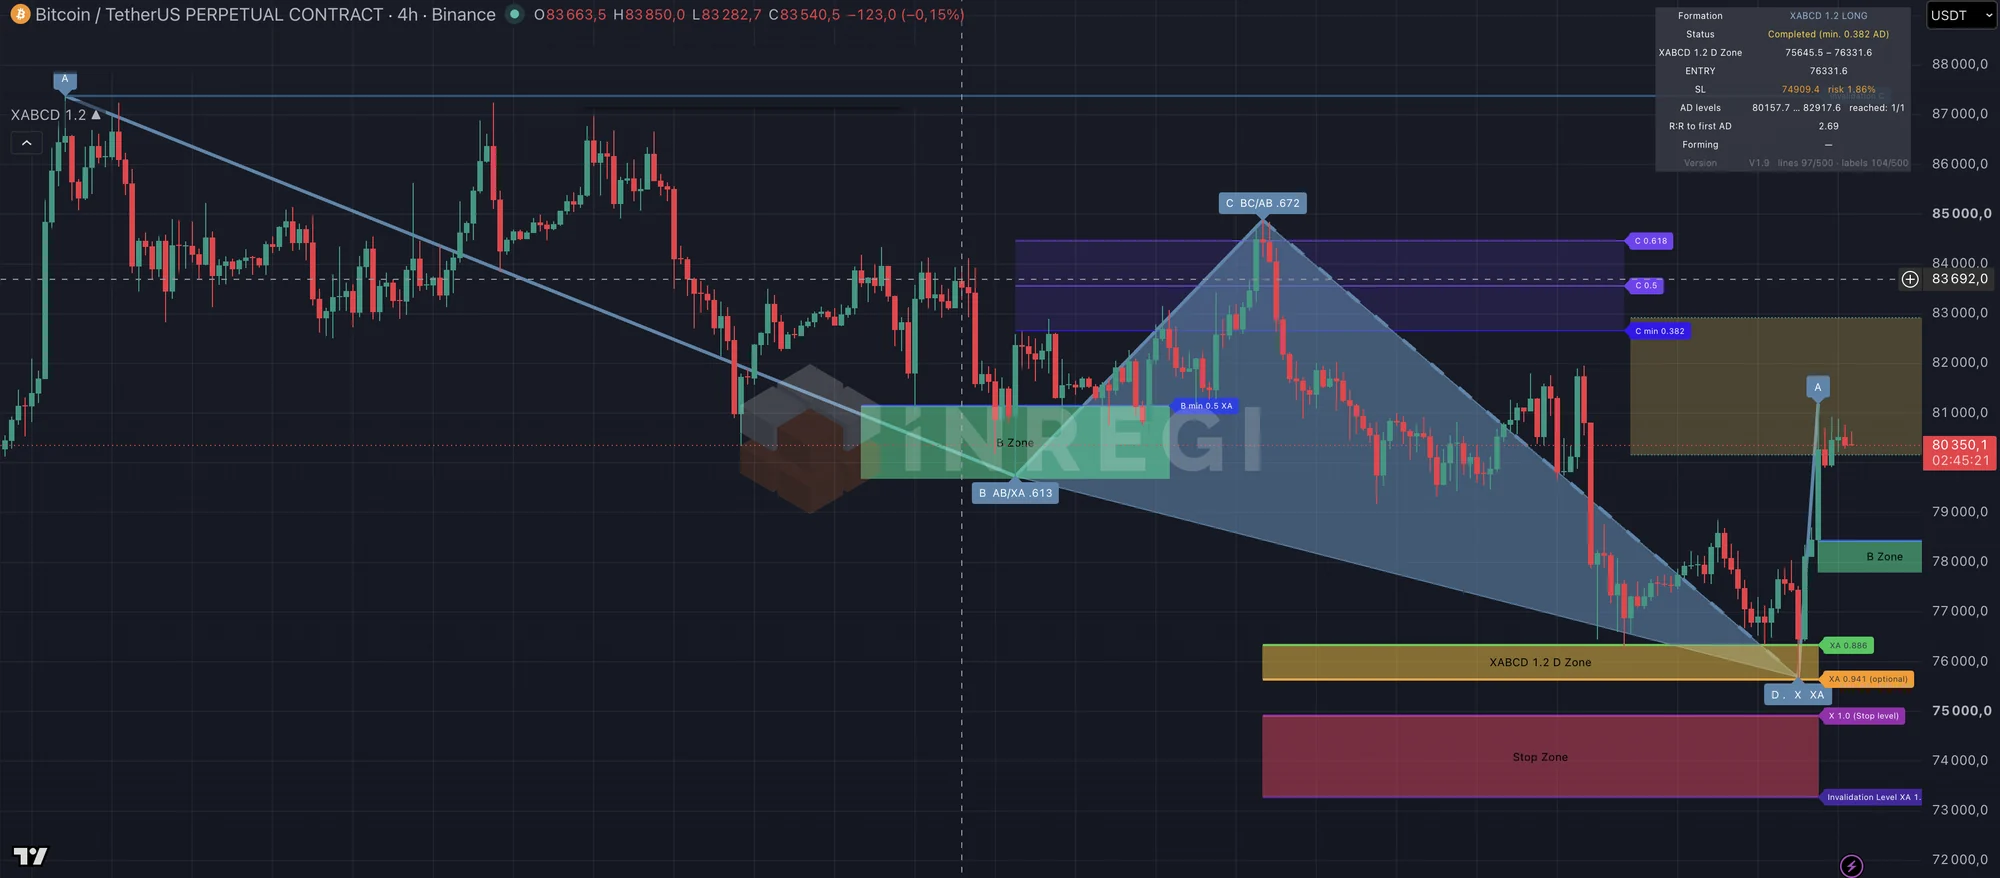
Formation 1.2 ▲ on BTC 4h. Selected example, not a performance result. The bearish version is its mirror image.
01
No manual measuring
B retracement, C depth and the D Zone measurements are checked automatically on every candle close.
02
See it before it completes
Live preview shows the potential B and C zones and the D Zone while the formation is forming.
03
One alert, then walk away
A "price touched D Zone" alert fires in real time, once per formation.
How it works
| Swing points | Detected on closed candles and confirmed after a short delay, so points never appear in hindsight. |
| X–A measurement | Two options: classic (swing low/high to swing high/low) and Strong Momentum X–A — X at the start of a smooth, impulsive move. Both can produce a valid formation — see Concepts. |
| Point B | 0.5 to below 0.618 of XA (zone Z2) |
| Point C | At least the AB leg 38.2% retracement (C min); levels 0.5 · 0.618 · 0.707 · 0.786 · 0.886 |
| D Zone (point D) | 0.886 XA + 0.941 XA, both on by default; optional 1.062. |
| Stop level | X (1.0 XA) |
| Stop zone | 1.0–1.131 XA |
| Invalidation | 1.131 XA |
| Targets | 38.2% and 61.8% AD, measured from the actual D |
B sits deeper than in formation 1.1, while D stays before X.
The stop level does not end the formation — the invalidation level does. That gives you a clear distinction between "my stop was hit" and "this formation is no longer valid".
Moving the D Zone to a touched level is a change of presentation, not a signal.
Colours: Bullish #5586AD · Bearish #5367D7 · D Zone gold · Stop Zone red
How to use
READY→IN PLAY→COMPLETEDorINVALIDATED
| Forming (live preview) | Potential B and C zones and the D Zone shown before the formation is confirmed. |
| READY | X–A–B–C is valid and the D Zone is projected. Wait for price. |
| IN PLAY | Price has touched the D Zone. D follows the furthest price inside the zone. |
| Completed | After the D Zone, price reached at least the 38.2% AD correction (D Zone respected). |
| Invalidated | A rule was broken (invalidation level touched, C beyond A…). Hidden by default — turn on "Show invalidated formations" to see them with the reason. |
| Panel | D Zone, entry, SL, risk %, R:R. Optional Position projection (R:R), B→C and C→D projections. |
| Alert | Set frequency to "Once per bar". After an indicator update, delete and recreate the alert. |
Repainting & limitations
All formation logic runs on closed candles only — no future data, no lookahead, no higher-timeframe requests. Below is every case where the drawing can still change, so nothing surprises you.
Can change after a candle closes
- Before C reaches C min, a deeper extreme in the B zone moves B.
- In READY, a close beyond C (before the D Zone) moves C and redraws the D Zone.
- In IN PLAY, D and the AD levels follow price deeper into the D Zone.
- When price touches a possible level, it becomes a proper level and the D Zone moves. Once a formation has played out, only proper levels remain.
- Invalidated formations are hidden by default.
- Old drawings are removed by "Number of recent formations kept" (5) and TradingView limits.
Fixed
- X and A — once the swing is confirmed.
- B — once C min is reached.
- C — once the formation is IN PLAY.
- Everything — after Completed / Invalidated.
Limits
- Any market and timeframe with OHLC data.
- Historical tests of the formation as a mechanical strategy showed no statistical edge after costs. Use the zones for analysis, not as a standalone signal.
Settings
| Display | Completed ✓ · Invalidated ✗ · Live preview ✓ · Formations kept: 5 |
| C levels | 0.382 · 0.5 · 0.618 · 0.707 · 0.786 · 0.886 ✓ — 0.414 / 0.941 optional |
| D Zone | 0.886 + 0.941 XA (on by default) · 1.062 optional |
| AD levels | Main: 0.236 · 0.382 ✓ · 0.5 · 0.618 ✓ — Additional: 0.146 · 0.191 · 0.314 · 0.414 · 0.707 · 0.786 · 0.886 (optional) |
| Projections | Position projection (R:R) · B→C · C→D — off by default |